The importance of a European eNPS
To what extent are employees within your organisation positive about being an employer? This is easy to test with the eNPS (employee Net Promoter Score). At the same time, the scores of Europeans are systematically more moderate than those of, say, Americans. From this, you can infer that European organisations have less enthusiastic employees than in the US. In this article, we therefore explain what the European eNPS means and why it is useful to take it into account.
Origin & definition eNPS
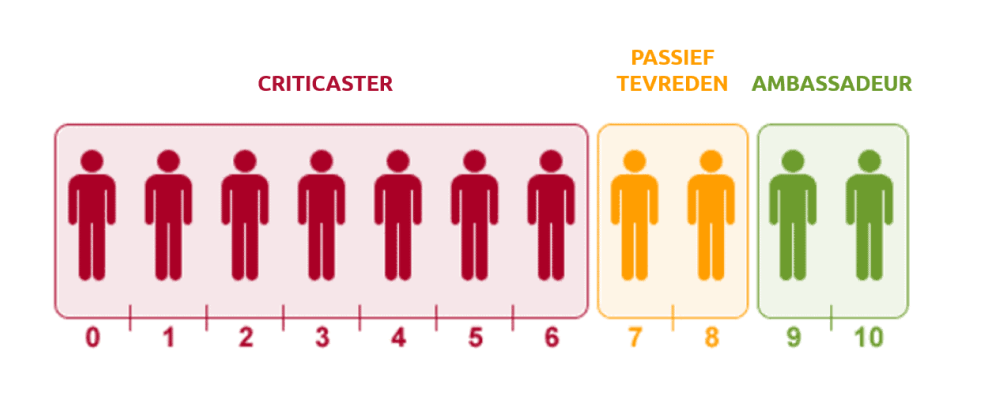
The eNPS is based on the NPS (Net Promoter Score), which was devised by management consultant Frederick Reichheld (Artz, 2017). He was looking for an accessible way to measure market loyalty without losing the quality of the research (Reichfeld, 2003). The answer to his question was the NPS. By asking just one question, "How likely are you to recommend this brand to family and friends?" consumer enthusiasm can be easily measured. This concept can also be adopted to measure employee loyalty towards the employer. Thus, the eNPS was born. Based on the level of recommendation, an employee is assigned to one of the following three groups:

Critics
Among this group of employees, they are least likely to recommend their employer to friends and family. They do see areas for improvement for the organisation.
Passively satisfied
These employees are moderately enthusiastic about their employer. On the one hand, this group does not actively recommend against the employer, but they are also not eager to convince friends and family to join the organisation.
Ambassadors
This group of employees consists of the people who are most enthusiastic about their employer and, as a result, they actively recommend the organisation to those around them. The eNPS score is calculated by quoting the number of critics from the number of ambassadors. The higher this score is, the more ambassadors there are in the organisation compared to the number of critics. The advantage of a high eNPS is that the organisation has a successful and positive corporate culture. In turn, this can also have the effect of attracting new talents and retaining (desired) staff (Hofhuis & van Hoog, 2010).
Difference between US and European eNPS measurements
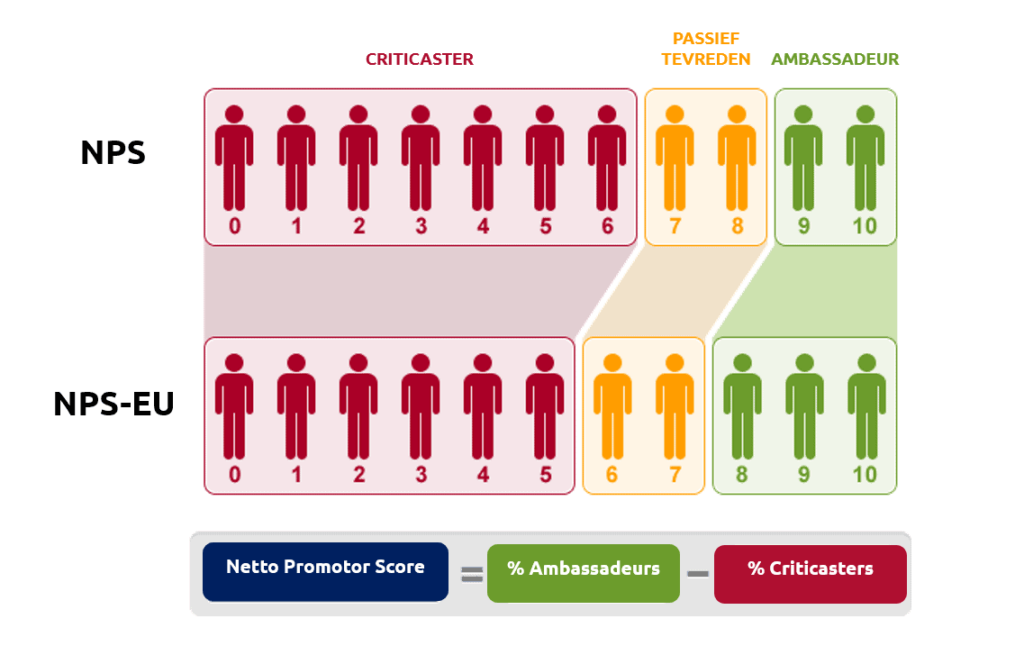
The reason behind differences in responses between US and European measurement was found in the research of Faltejsková, Dvořáková, & Hotovcová (2016). They noted that cultural perceptions of grades are very different when comparing the United States with the Netherlands. Dutch employees show more reluctance to award a perfect score of 10, due to the attitude that there is always room for improvement. This is also known as the 'Dutch effect'. On the other hand, higher marks are more likely to be awarded in the United States at all.
Because of these differences, the European measurement included that participants are more likely to be seen as passively satisfied or ambassadors (Janmaat & van Herk, 2014), as can be seen in the figure below:

More opportunities for international analysis
Adopting the European measurement in the Netherlands also creates a more accurate ability to employee surveys with each other.
Surveys conducted in different countries can now be compared more fairly, as cultural bias has been taken into account; employees in Europe tend to give lower marks than those in the United States (Stoop, 2006).
This makes it easy to employee surveys with other organisations, as the results can be benchmarked against international surveys. This applies to companies that are in the same industry, but also to organisations that operate internationally.
The European eNPS as an innovative lever
The move to the European eNPS in the Netherlands shows the benefits of a customised approach to measuring employee satisfaction.
The 'Dutch effect', where Dutch employees are reluctant to give perfect scores, indicate the relevance of using a European measurement method.
The European eNPS not only provides accurate evaluations at the local level, but also valuable insights for international comparisons. By embracing this approach, we not only improve our local measurements but also gain valuable knowledge from global benchmarks.
Curious about your organisation's eNPS score? Feel free to plan via this link a demo call with us!
Bibliography
Artz, M. (2017). NPS-The One Measure You Really Need to Grow. Controlling & Management Review, 61, 32-38.
Faltejsková, O., Dvořáková, L., & Hotovcová, B. (2016). Net Promoter Score Integration into the Enterprise Performance Measurement and Management System-A Way to Performance Methods Development. Economics and Management.
Hofhuis, J., & Van't Hoog, M. (2010). Handbook on Successful Diversity Interventions. The Hague: Ministry of the Interior and Kingdom Relations. doi, 10(2.1), 4000-3361.
Janmaat, F., & van Herk, H. (2014). How Comparable is the Net Promoter Score Across Countries. Monthly Journal of Accountancy and Business Economics, 88, 282.
Reichheld, F. F. (2003). The One Number You Need to Grow. Harvard Business Review, 81(12), 46-55.
Stoop, I. (2006). Country Comparative Surveys: Comparison between Countries and between Surveys. Developments in Market Research, 95.
