In short
- The Net Promoter Score (NPS) measures the level of loyalty by asking how likely people are to recommend a product, service or organisation.
- A high NPS suggests ambassadorship and word-of-mouth, but says little about why someone is enthusiastic.
- The NPS is not a full substitute for extensive questionnaires - think of it as a thermometer: useful to spot trends, but not to provide all the insights.
- In an employee context (eNPS): preferably combine the NPS with questions on satisfaction, commitment and organisational drivers.
Management consultant Frederick Reichheld was looking for an alternative to the long questionnaires in market surveys. He wanted to be able to measure satisfaction and brand loyalty in an easy and quick way, without compromising the quality of the survey. That is why he created the Net Promoter Score (NPS) in 2003.1 This measurement tool would make it possible to measure loyalty using just one question: 'How likely are you to recommend this brand to family and friends?' Easy? Check. Quick? Check. This makes the NPS sixteen years later still a widely used tool in many different types of research. But what exactly does the NPS say? And does this score make an extensive questionnaire unnecessary?
Definition NPS
The NPS is a management tool that can be used to measure loyalty. The score is based on the likelihood that people will recommend a product, brand or organisation to acquaintances, friends and family.
What does the NPS say?
Individuals who would recommend a product to others can be seen as ambassadors of the brand. A product that is recommended will come to the attention of potential consumers in a positive way. Since NPS is thus based on the principle of word-of-mouth, it is not surprising that some studies find a link between NPS and sales figures.2 However, this effect is only found for existing trends. There is little to no evidence that NPS can be used as a predictor of growth, as claimed by Frederick Reichheld.3
Nevertheless, the NPS does say something about the extent to which consumers are enthusiastic about a brand or product. It can therefore be seen as an indicator of satisfaction and brand loyalty. So while it is not advisable to rely solely on the NPS in a survey, it can be a valuable part of a more comprehensive questionnaire.
Meanwhile, the NPS has long since ceased to be used only in market research. In fact, NPS is used in every context where supply and demand play a role. Whether you are talking about recommending a new restaurant, a holiday destination or - in the case of employee survey - an employer.
How is the NPS calculated?
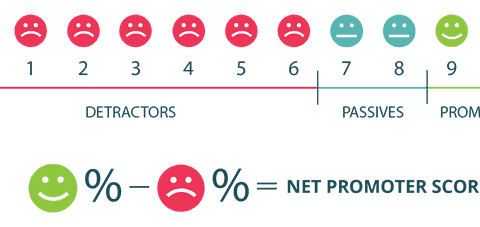
Let's stay with the above-mentioned employee survey. When talking about recommending an employer, it is also referred to as the employer NPS (eNPS). The question needed to calculate the NPS then reads, "How likely are you to recommend this organisation as an employer to friends or family?". The respondent answers this question with a rating from 1 (very unlikely) to 10 (very likely). You might expect the NPS to be the average rating given for this question. In reality, however, it is slightly more complicated. First, respondents are divided into three groups:
Detractors (critics)
With a score of 0 to 6, respondents are marked with the English word Detractors. There is no really good Dutch translation of this word, but it comes closest to 'Opponents' or 'Critics'. Within this category, these individuals are unlikely to recommend their employer to friends and family. Now you may be thinking: surely a 6 is enough? Yet research has shown that even with a meagre enough, people are still not enthusiastic enough to actually make recommendations.
Passives (passive neutral)
With a score of 7 or 8, respondents are categorised as Passives. These are individuals who are moderately enthusiastic about their employer and where the likelihood of them recommending is therefore average. These people are not dissatisfied with their employer, but are also unlikely to try to convince their friends and family to join the organisation.
Promoters (ambassadors)
At a score of 9 or 10, respondents are Promoters. These individuals are ambassadors of the organisation, and so recommending their employer to friends and family is very likely. These are the individuals who are most satisfied with their employer and most loyal to the organisation.
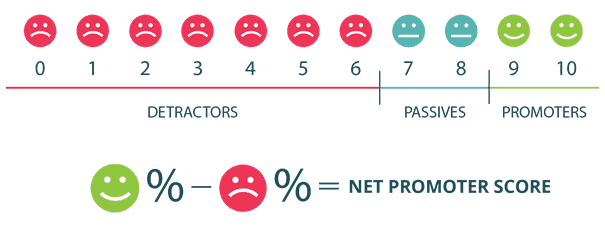
The NPS is basically the difference between the number of promoters and the number of detractors. It is therefore calculated by subtracting the percentage of detractors from the number of promoters. The simplicity of this method means that the NPS is used in many different situations. Little knowledge about research methodologies is needed.
What is a good NPS?
When there are more promoters than detractors, the NPS is a positive number. When most of the respondents fall under detractors, the NPS is negative. So the most important thing is that the NPS is above 0. In the ideal world where every employee would be a promoter, the NPS would be 100. However, this is almost impossible. However, the rule is: the higher, the better.
Does the NPS make a comprehensive questionnaire unnecessary?
As you might have felt coming, the answer is no. It is true the NPS is a measure of loyalty, and can lead to word-of-mouth. However, it is difficult - if not impossible - to measure loyalty from a single question.4 Asking one question suggests that loyalty has only one dimension. Other aspects of loyalty are hereby omitted. For example, is the employee also proud to be employed at the organisation? And would he or she also prefer the organisation to rival companies?
In the case of market research - where the NPS became big - asking just one question to establish loyalty is less problematic. After all, choosing a product is a lot less complex than choosing an employer. In employee survey it is smarter to choose to combine the NPS with questions about satisfaction and involvement. Not only because the choice is more complex, but also because an employee survey is often meant to develop. It is therefore not only valuable to know the organisation's NPS, but even more so to find out where the areas for improvement lie. And the NPS simply cannot provide that information.
Satisfaction and loyalty are complex constructs that cannot be captured in a single question. So do not regard the NPS as an all-purpose tool to employee satisfaction or loyalty measure. Rather, think of it as a thermometer. You can tell from it if something is not right, but it does not provide information about what exactly is going on.
Sources
- Reichheld, F. F. (2003). The one number you need to grow. Harvard business review, 81(12), 46-55.
- Shaw, R. (2008). Net promoter. Journal of Database Marketing & Customer Strategy Management, 15(3), 138-140.
- Keiningham, T. L., Cooil, B., Andreassen, T. W., & Aksoy, L. (2007). A longitudinal examination of net promoter and firm revenue growth. Journal of Marketing, 71(3), 39-51.
- Keiningham, T. L., Aksoy, L., Cooil, B., & Andreassen, T. W. (2008). Linking customer loyalty to growth. mIt Sloan management review, 49(4), 51.